Blog
Featured Content

How to Create Winning Facebook Ads for E-commerce Brands
In the ultra-competitive world of e-commerce, Facebook ads are the cornerstone of customer acquisition and revenue growth. But with 97% of advertisers reporting rising costs and shrinking margins, standing out requires more than just guesswork. To dominate, you need a systematic approach powered by real-time market data, competitor intelligence, and precise audience targeting.
This guide will walk you through a step-by-step framework to create high-converting Facebook ads, with actionable examples, advanced tools like adspy platforms, and strategies to scale profitably.
Step 1: Validate Product-Market Fit with Cross-Platform Research
Why It Matters
No amount of ad brilliance can save a product nobody wants. Start by identifying items with proven demand.
A. Analyze Bestsellers on Major Platforms
Tools like Amazon product research tools reveal real-time sales data:
- Sales velocity: Items selling 500+ units/day (e.g., “portable air fryers”).
- Seasonal spikes: “Swimwear” surging 300% MoM in Q2.
- Emerging niches: “Reusable silicone food bags” growing 200% MoM on Temu.
Case Study: A dropshipper noticed “heated massage guns” trending on Temu with a 400% sales spike. Using e-commerce trend discovery tools, they confirmed the trend was rising on Shopify and Facebook. They launched targeted ads to fitness enthusiasts, generating $60k in 30 days.
B. Discover Untapped Niches with Keyword Gaps
Use keyword research tools to find high-demand, low-competition terms:
- Example: “Eco-friendly yoga mats” has 12,000 monthly searches but only 3 competitors.
- Action: Create Facebook ads targeting “sustainable fitness” audiences with USP-focused copy (“100% Recycled, Non-Slip Design”).
C. Leverage Social Proof from TikTok & Instagram
Platforms like TikTok often spark trends before they hit e-commerce. Tools that monitor viral social media ads can help you:
- Identify hashtags (#TikTokMadeMeBuyIt) driving product virality.
- Spot UGC trends (e.g., unboxing videos for “aesthetic desk organizers”).
Step 2: Reverse-Engineer Competitor Ads with Adspy Tools
Why Competitor Analysis is Non-Negotiable
Your competitors have already spent thousands testing what works. Learn from their wins and losses.
A. Deconstruct Top-Performing Ads
Using Facebook ad spy tools, filter ads by:
- Engagement rate: Ads with 5x average likes/comments.
- Ad longevity: Campaigns running 6+ months (indicating profitability).
- Landing pages: Analyze if competitors use urgency (“24-Hour Sale”) or scarcity (“Only 3 Left”).
Example: A skincare brand found competitors’ ads for “hyaluronic acid serums” used “dermatologist-approved” claims. They replicated the angle but added “vegan & cruelty-free” differentiation, boosting CTR by 27%.
B. Decode Audience Targeting & Budget Patterns
Advanced ads spy tools reveal:
- Demographics: Age, gender, location of engaged users.
- Estimated budgets: Competitors spending $5k/month on “posture correctors” signals a lucrative niche.
- Ad variations: How rivals A/B test headlines or CTAs.
Pro Tip: Export competitor ad data to a spreadsheet and look for patterns (e.g., video ads outperform carousels in your niche).
Step 3: Hyper-Target Your Audience with Layered Filters
Beyond Basic Demographics
Facebook’s targeting goes far beyond age and gender. Combine multiple data points for precision.
A. Layer Interests with Behavioral Signals
- Purchase behavior: Target users who bought “similar products” in the last 30 days.
- Device usage: Mobile users prefer snackable videos; desktop users engage with detailed carousels.
- Life events: Target new parents with baby products or recent graduates with career tools.
B. Refine with Keyword Intent
Use keyword tools to align ad copy with search intent:
- High-volume terms: “Affordable workout gear” (10k+ searches/month).
- Buyer intent phrases: “Best organic shampoo for curly hair” vs. “shampoo reviews.”
Example: For a yoga mat brand, target users interested in “home workouts” AND who searched for “non-slip yoga mats” recently.
C. Exclude Irrelevant Audiences
Save budget by excluding:
- Users who already purchased.
- Low-intent audiences (e.g., those who clicked but didn’t convert in 7 days).
Step 4: Craft Scroll-Stopping Ad Creatives
The 3-Second Rule
You have 3 seconds to grab attention. Here’s how:
A. Video Ads That Convert
- Demo videos: Show your product solving a problem (e.g., a “stain remover pen” erasing coffee spills).
- UGC testimonials: Feature real customers sharing results.
- Behind-the-scenes: Build trust with factory tours or team stories.
Best Practices:
- Hook in the first 3 seconds: Start with a question (“Tired of back pain?”) or shocking stat (“9/10 dentists recommend”).
- Add subtitles: 85% of Facebook videos are watched muted.
B. Copywriting Formulas That Sell
- PAS Framework:
- Problem: “Struggling to sleep through the night?”
- Agitate: “Tossing and turning ruins your productivity.”
- Solution: “Our weighted blanket promotes deep, uninterrupted sleep.”
- FOMO-Driven CTAs: “Last Chance: 50% Off Ends Tonight!”
- Social Proof: “Join 10,000+ Satisfied Customers.”
Case Study: A jewelry brand tested two headlines:
- “Elegant Necklaces for Women” (CTR: 1.2%).
- “The Necklace Celebrities Can’t Stop Wearing” (CTR: 3.8%).
Step 5: Launch & Optimize with Surgical Precision
A. A/B Test Everything
Test one variable at a time:
- Ad formats: Video vs. carousel vs. collection ads.
- Audience segments: Women 25-34 vs. 35-44.
- Landing pages: Product page vs. quiz-style funnel.
Example: A pet brand tested two CTAs:
- “Shop Now” (CTR: 2.1%).
- “Get 50% Off First Order” (CTR: 4.7%).
B. Track Metrics That Drive ROI
- CTR: Below 1%? Improve hooks or targeting.
- CPC: Rising costs? Pause underperforming ads.
- ROAS: Aim for 3x+ to ensure profitability.
Use Shopify store analytics to monitor how ad traffic converts. For example, if an ad drives 1,000 clicks but 0 sales, check:
- Page load speed: 53% of mobile users abandon pages taking >3s to load.
- Trust signals: Add reviews, guarantees, or payment badges.
Step 6: Scale Profitable Campaigns Strategically
A. Retarget Engaged Audiences
- Cart abandoners: Offer a 10% discount via dynamic ads.
- Video viewers: Retarget users who watched 75% of your video.
- Email subscribers: Run exclusive Facebook offers.
B. Expand with Lookalike Audiences
Upload your customer list to create lookalike audiences. For higher precision, use e-commerce scraping data to segment:
- High-value buyers: Users who spent $100+.
- Repeat purchasers: Target lookalikes of loyal customers.
Pro Tip: Layer lookalikes with interest targeting (e.g., “lookalike + yoga enthusiasts”) for higher relevance.
How Diffshop Powers Every Stage of Your Facebook Ad Strategy
1. Cross-Platform Product Validation
Diffshop’s product research tool tracks 1B+ products across Amazon, Shopify, Shein, and Temu. Filter by:
- Sales velocity: Items selling 500+ units/day.
- Launch date: Spot trends like “solar-powered garden lights” before competitors.
- Rating trends: Products with rising 4.5+ stars indicate growing demand.
Case Study: A seller found “magnetic eyelashes” trending on Shein with a 300% MoM spike. They validated demand on Shopify and launched Facebook ads targeting beauty enthusiasts, generating $45k in 3 weeks.
2. Adspy for Viral Creative Inspiration
Diffshop’s adspy tool scans 10M+ Facebook, Instagram, and TikTok ads. Use it to:
- Find winning hooks: “This $10 Tool Organizes Your Entire Kitchen!”
- Analyze competitor funnels: See if rivals drive traffic to Amazon listings or Shopify stores.
- Track ad fatigue: Identify when competitors refresh creatives (e.g., new angles for “posture correctors”).
Example: A DTC brand discovered TikTok ads for “acne patches” using “30-day challenge” storytelling. They adapted the format for Facebook, reducing CPA by 33%.
3. Competitor Store Reverse-Engineering
Diffshop’s store research tool reveals:
- Traffic sources: 60% from Facebook ads, 30% from SEO.
- Bestsellers: Top 10 products by revenue.
- SEO keywords: Terms like “affordable workout gear” driving organic traffic.
Case Study: A home decor brand analyzed a competitor’s store and found “modern wall art” was their bestseller. They created Facebook ads highlighting “handcrafted designs,” stealing 20% market share.
4. Keyword-Driven Optimization
Diffshop’s keyword research tool tracks 200M+ search terms. Use it to:
- Optimize product listings: Align titles with high-volume keywords.
- Boost ad relevance: Use exact match terms in headlines and CTAs.
- Discover niches: Rising terms like “biodegradable phone cases.”
Advanced Tactics for Seasoned Advertisers
**A. Dynamic Product Ads (DPAs)**
Automatically show users products they viewed but didn’t buy. Pair with urgency: “Back in Stock: Your Cart Items Are Selling Fast!”
B. Sequential Retargeting
- Awareness: Broad audience with educational videos.
- Consideration: Retarget viewers with demo videos.
- Conversion: Offer a time-sensitive discount.
C. Geo-Targeting for Localized Campaigns
Example: Promote “winter coats” to users in colder regions (e.g., Canada, Scandinavia).
Final Checklist for Facebook Ad Success
- Validate product demand with cross-platform data.
- Reverse-engineer competitor ads using adspy tools.
- Layer targeting with behavioral + keyword insights.
- Test multiple creatives and CTAs.
- Scale winners with lookalike audiences.

How to Spy on Competitors' Amazon Product Listings to Stay Ahead
In the hyper-competitive world of Amazon selling, staying ahead of rivals requires more than just a great product—it demands a strategic edge. Imagine knowing your competitors’ next move before they make it: which products they’ll launch, which keywords they’re targeting, and how they’ll price their items. This isn’t a fantasy; it’s the power of an Amazon Spy Tool like Diffshop, a comprehensive platform designed to turn competitor data into actionable insights. In this guide, we’ll dive deep into proven tactics for analyzing Amazon listings, reveal real-world success stories, and show how Diffshop can help you dominate your niche.
Why Competitor Analysis Is Non-Negotiable on Amazon
Amazon’s algorithm is a ruthless gatekeeper. It prioritizes products with high relevance, stellar reviews, and rapid sales velocity. To win, you must decode your competitors’ strategies:
- Spot Trends Early: Identify products gaining traction before they saturate the market.
- Optimize Listings: Reverse-engineer high-performing keywords and content.
- Master Pricing: Adjust dynamically without sacrificing profit margins.
- Fill Gaps: Turn competitors’ weaknesses into your strengths.
But manual research is a losing game. Scrolling through thousands of listings, ads, and reviews is time-consuming and error-prone. This is where an Amazon Spy Tool becomes indispensable. Tools like Diffshop automate the process, delivering real-time data across Amazon, Shopify, social media, and more—all in one dashboard.
5 Tactics to Outsmart Competitors (and How Diffshop Delivers Results)
1. Track Best-Selling Products Like a Pro
The first rule of Amazon warfare: know what’s selling. Top-performing products often hide in plain sight, but spotting them requires the right filters.
Action Steps:
- Use a product research dashboard to filter by metrics like “units sold” or “month-over-month growth.”
- Focus on products with sudden sales spikes—they often signal viral or seasonal demand.
How Diffshop (Your Amazon Spy Tool) Helps:
Diffshop’s Amazon Product Tracker 1 billion+ products across Amazon, Shopify, and Temu. For example, a pet supplies seller discovered a 200% surge in self-warming cat beds. By launching a competing product with eco-friendly materials, they captured 20% market share in 30 days.
Pro Tip: Pair this with Diffshop’s Trend Discovery Tool to cross-reference Amazon trends with social media buzz.
2. Reverse-Engineer Competitors’ SEO Secrets
Keywords are the lifeblood of Amazon SEO. If your competitors rank for “organic face serum,” you need to know why—and how to outrank them.
Action Steps:
- Analyze competitors’ titles, bullet points, and backend keywords.
- Target long-tail phrases with high search volume but low competition.
How Diffshop (The Ultimate Amazon Spy Tool) Helps:
Diffshop’s Keyword Analyzer scans 200 million+ e-commerce keywords, revealing hidden gems like “vegan anti-aging serum for sensitive skin.” A beauty brand used this data to boost organic traffic by 75% in 6 weeks.
Case Study:
A home goods seller struggled to rank for “modern coffee tables.” Diffshop uncovered that top competitors used backend keywords like “mid-century design” and “easy assembly.” After updating their listings, sales jumped by 40%.
3. Monitor Pricing Strategies in Real Time
Price wars can crush margins. To stay competitive, you need to track rivals’ pricing tactics—and strike back strategically.
Action Steps:
- Track price changes across Amazon, Walmart, and Shopify.
- Counter discounts with bundled offers or value-added promotions.
How Diffshop Helps:
The Price Monitoring Tool sends instant alerts when competitors drop prices. An electronics seller used this to counter a rival’s Friday discounts with weekend “free shipping” offers, retaining their #1 Best Seller rank.
Pro Tip: Use historical pricing data to predict future promotions. For instance, if a competitor discounts yoga mats every January, plan your promotions early.
4. Decode Competitors’ Ad Campaigns
Sponsored Product ads dominate Amazon search results. But winning ads don’t stay secret for long—if you have the right Amazon Spy Tool.
Action Steps:
- Study competitors’ ad creatives, CTAs, and landing pages.
- Replicate high-performing angles but add unique selling points (e.g., “30-day guarantee”).
How Diffshop Helps:
The Ad Intelligence Tool monitors 10 million+ ads on Facebook, Instagram, and TikTok. A fitness seller replicated a competitor’s TikTok ad format (15-second workout demos) but added a “results guarantee,” tripling their CTR.
Case Study:
A skincare brand noticed rivals using “dermatologist-approved” claims in Facebook ads. They launched similar ads but highlighted “cruelty-free certification,” boosting conversions by 55%.
5. Exploit Competitors’ Weaknesses Through Reviews
Negative reviews are goldmines. They reveal flaws you can fix to position your product as the superior choice.
Action Steps:
- Use sentiment analysis to identify recurring complaints (e.g., “poor durability”).
- Highlight solutions in your listings (e.g., “unbreakable design”).
How Diffshop Helps:
The Review Analyzer scans millions of reviews for pain points. A kitchenware seller discovered 38% of competitors’ air fryer reviews mentioned noise issues. They launched a “quiet technology” model, dominating the niche within weeks.
Pro Tip: Address shipping complaints by emphasizing “fast delivery” or “free returns” in your listings.
**Why Manual Research Fails (and How Diffshop Fixes It)**
Manual competitor analysis has three fatal flaws:
- Data Overload: Too many listings, too little time.
- Blind Spots: Missing cross-platform trends (e.g., TikTok virality precedes Amazon success).
- Human Error: Misinterpreting data or missing patterns.
Diffshop solves these by:
- Consolidating Data: Track Amazon, Shopify, social media, and Google in one place.
- Automating Alerts: Get notified about price changes, new launches, or negative reviews.
- Simplifying Filters: Narrow results by sales revenue, SEO difficulty, or ad engagement.
Diffshop vs. Other Amazon Spy Tools: Why It Wins
Most tools focus narrowly on Amazon or lack social media integration. Diffshop stands out with:
- Cross-Platform Mastery: Track Amazon listings, TikTok ads, Shopify stores, and Google keywords.
- AI-Powered Insights: Predict trends using historical data and machine learning.
- Affordability: Plans start at $29/month—cheaper than hiring a data analyst.
Case Study:
A dropshipper used Diffshop to spot a trending “phone sanitizer” on TikTok. They sourced the product, optimized their Amazon listing with viral keywords, and generated $120k in sales before competitors caught on.
Step-by-Step: How to Use Diffshop as Your Amazon Spy Tool
- Sign Up: Start a free trial.
- Set Goals: Are you tracking products, ads, or keywords?
- Apply Filters:
- For product research: Filter by “sales revenue” or “launch date.”
- For ads: Filter by “engagement rate” or “ad spend.”
- For keywords: Filter by “SEO difficulty” or “search volume.”
- Analyze & Act: Launch products, tweak listings, or adjust pricing based on insights.
Future-Proof Your Amazon Business with Diffshop
The e-commerce landscape evolves fast. Stay ahead by:
- Leveraging Social Media Trends: Use Diffshop’s TikTok Ad Tracker to spot viral products early.
- Automating Tasks: Let AI handle keyword optimization, pricing rules, and review monitoring.
- Building a Data-Driven Team: Train your team to interpret metrics like “month-over-month growth” or “customer lifetime value.”
Conclusion: Spy Smarter, Scale Faster
In Amazon’s cutthroat arena, guessing games won’t cut it. With an Amazon Spy Tool like Diffshop, you gain a 360-degree view of competitors’ strategies—from pricing to TikTok ads. It’s not just about keeping up; it’s about staying three steps ahead.
Ready to transform data into dominance? Your secret weapon is one click away.

10 Metrics E-commerce Business Should Track for Growth | Diffshop
10 Metrics Every E-commerce Business Owner Should Track for Growth
The average e-commerce conversion rate hovers around 3%. This number might seem low, but it represents just one metric in the complex landscape of online business performance. Cart abandonment rates can reach 80%, which shows why tracking these numbers is vital to succeed.
Our research reveals that thriving e-commerce businesses track at least 20 different metrics regularly. These measurements, from customer lifetime value to acquisition costs, give an explanation about your business's health. The reality of $165 million in returns per billion in sales and the need to boost Net Promoter Scores make these metrics even more significant. We'll help you understand the most valuable measurements to grow your online store.
This detailed piece will show you the basic metrics that help you make evidence-based decisions. You'll discover clear opportunities to improve your e-commerce business.
Why Track E-commerce Metrics
Ecommerce metrics are the foundations of successful online retail operations. Data shows that businesses using real-time metrics perform 22% better in operational efficiency and 20% better in state-of-the-art solutions. These measurements tell you about your store's health and growth potential.
Impact on business decisions
Good business decisions need reliable data. Businesses that trust real-time data create better customer experiences and show more business agility. The core team can spot threats or opportunities and change direction without extra approvals when they have access to real-time metrics.
Tracking ecommerce metrics does more than help daily operations. Studies show that Gen Z (67%) and millennials (68%) think brand consciousness about emissions is highly important, compared to Gen X (58%) and baby boomers (57%). Companies that track sustainability metrics can line up their operations with customer values and optimize operations.
Role in sustainable growth
E-commerce growth depends on complete metric tracking. Research shows companies that focus on sustainability metrics see stronger growth in their eco-friendly product lines and get higher market multiples. Companies that put proper tracking systems in place can boost revenue between 6% to 12%.
Tracking ecommerce metrics helps sustainable growth in these ways:
- Spots resource conservation opportunities
- Makes operations more efficient
- Sets clear standards for accountability
- Shows progress toward environmental goals
Ecommerce performance metrics help businesses understand customer behavior better. Companies can shape their offerings by analyzing buying patterns, price elasticity, and what drives loyalty. These metrics help find ways to improve circularity and reduce carbon across product categories.
Data tracking protects customer information effectively. Strong consent management systems and clear data collection practices build customer trust. This approach follows regulations and respects consumer choices, which helps build lasting business growth.
Getting Started with Basic Sales Metrics
Simple sales metrics are the life-blood of successful e-commerce operations. Let's explore three key measurements that shape business decisions and propel development.
Total revenue tracking
Total revenue represents the sum of all completed sales within a specific period. We used it to gage overall business health. This metric helps identify growth patterns and seasonal trends. The calculation involves adding up all sales values while excluding returns and canceled orders.
Google Analytics 4 helps businesses identify their most valuable marketing channels, landing pages, and keywords through revenue tracking. This knowledge helps optimize marketing budgets and improve return on investment.
Number of orders
The number of orders metric reflects all confirmed purchases within a defined timeframe. This measurement helps determine cost formulas, inventory requirements, and economic order quantity (EOQ).
Order count shows:
- Customer demand patterns
- Sales trends
- Operational effectiveness
- Market position
Average order value
Average order value (AOV) shows how much customers typically spend in a single purchase. The calculation involves dividing total revenue by the number of orders. To cite an instance, see a store that generates $50,000 in revenue from 250 orders - the AOV would be $200.
AOV matters especially when you have direct impact on profitability without additional customer acquisition costs. Most online retailers in the United States average about $78 per order. Desktop users show 20% higher AOV than mobile or tablet users.
Your AOV helps set realistic revenue goals. A store with an AOV of $45 would need approximately 222 customers to achieve $10,000 in monthly sales.
This metric also shows:
- Product pricing effectiveness
- Customer buying patterns
- Marketing strategy success
Businesses can boost their AOV through:
- Creating product bundles
- Offering free shipping thresholds
- Implementing loyalty programs
Live chat integration shows promising results. Businesses report 10-15% higher cart values with this feature. Evidence-based decisions that come from tracking these simple sales metrics encourage green growth.
Understanding Customer Behavior Metrics
Customer behavior metrics show us what makes e-commerce tick. Let's look at two simple measurements that help us learn about how shoppers act and what their priorities are.
Conversion rate basics
A conversion happens when someone takes a desired action on your website. Many actions can count as conversions, but the order conversion rate matters most in e-commerce. Yes, it is the percentage of website visits that end in completed purchases.
You can find your conversion rate by dividing orders by total website visits and multiplying by 100. E-commerce websites typically see conversion rates of 1% to 4%.
All the same, these numbers change by a lot based on several factors:
- Desktop users convert at 3%
- Tablet users show a 3% conversion rate
- Mobile users convert at 2%
Food and beverage businesses, along with health and beauty companies, had the best conversion rates in 2022. Therefore, knowing your industry's standards helps you set achievable goals.
Cart abandonment patterns
Shopping cart abandonment is one of e-commerce's biggest problems, with nearly 70% of shoppers leaving items in their carts without buying. The numbers look even more striking by device:
- Desktop shows 73.07% abandonment
- Tablets experience 80.74% abandonment
- Mobile guides with 85.65% abandonment
Customer concerns drive most cart abandonments. Extra costs make 48% of shoppers abandon their carts, while 24% leave because they must create an account. Like this, 22% of potential customers give up when delivery takes too long.
Cart abandonment affects industries differently. Home furnishing tops the list at 90.50%, with automotive following at 85.97%. APAC region leads global cart abandonment at 82%.
Age makes a difference too. Shoppers between 25-34 years have the highest abandonment rate at 21%, with the 35-44 age group close behind at 20%. Cart abandonments drop during each month's final days.
These patterns show businesses where to focus their solutions. To cite an instance, guest checkout options and upfront cost transparency can reduce abandonment rates by a lot. On top of that, multiple payment choices and a secure website help build customer trust.
Measuring Customer Value
The value each customer brings to your business gives you a clear picture of what drives sustainable growth. Two metrics tell this story best: customer lifetime value and repeat purchase rate.
Customer lifetime value
Customer lifetime value (CLV) shows how much revenue a business can expect from a customer throughout their relationship. We focused on long-term value instead of single transactions. This helps businesses make smart decisions about getting and keeping customers.
Your CLV calculation needs these elements:
- Average purchase value
- Purchase frequency
- Customer lifespan
- Gross margin
To name just one example, let's look at customers who spend $50 per purchase and buy 5 times yearly over 3 years. Their CLV would be $750. The gross margin gives us a better picture of how profitable these customers are. A 60% gross margin means the actual CLV would be $600 in this case.
CLV helps businesses spot their best customers and create better marketing plans. This knowledge lets you spend your resources wisely to get new customers. You can also build targeted strategies to keep existing ones and predict future revenue.
Repeat purchase rate
Repeat purchase rate (RPR) shows how many customers buy from your store more than once. This number changes a lot between industries, which gives us good standards to measure against.
CBD products top the list with a 36.2% RPR. High-performance sports and athletic products follow close behind at 33%. Products like meal deliveries and supplements maintain about 29% RPR, while tea products show 20.9%.
RPR has a direct effect on your revenue. Picture this: if you have 10,000 customers spending $100 on average, a 20% RPR means 2,000 customers buy again. This creates $200,000 in extra revenue.
Products that people use regularly show higher repeat rates than one-time purchases. That's why brands selling directly to consumers who focus on customer connections and tailored messages often keep more customers.
The link between CLV and RPR becomes clear in subscription businesses. A customer's value grows as they stay with a brand. Companies that keep their customers happy through loyalty programs and great service see both these numbers improve.
Traffic and Acquisition Metrics
Every online store owner needs to know their visitor sources and acquisition costs. These ecommerce metrics shape business growth and success.
Website traffic sources
Direct traffic makes up 27% of all ecommerce visits. This shows strong brand recognition and customer loyalty. These visitors type your URL directly or use bookmarks to reach your store.
Organic search brings in 22% of total traffic. Visitors find your store through unpaid search results, which shows how well your SEO works. New customers often find brands this way, making it a vital channel for growth.
Paid search drives 19% of ecommerce traffic. This channel lets you target specific keywords and audiences to reach people looking for products like yours.
Email marketing brings 5% of overall traffic, and paid social media accounts for 4%. Organic social media adds 1%. The other 22% comes from sources of all types including affiliate marketing and referrals.
Customer acquisition cost
Customer acquisition cost (CAC) shows how much you spend to get a new customer. This metric includes all marketing and sales expenses:
- Marketing software and tools
- Staff salaries
- Advertising fees
- Content creation costs
Small ecommerce businesses with fewer than four employees spend about $58.64 to acquire each customer. This number usually goes up as companies grow. A balanced ratio becomes vital in these cases.
The sweet spot for customer lifetime value (CLV) to CAC ratio lies between 3:1 and 5:1. A ratio above this range means you might be missing growth opportunities. A lower ratio shows you're spending too much to get customers.
Businesses can optimize their CAC by:
- Making their website SEO better
- Finding their best marketing channels
- Focusing on valuable customer segments
Studies show companies that excel at getting customers are 60% more likely to beat their competition. Understanding these metrics helps make informed decisions that propel sustainable growth and profitable customer relationships.
Product Performance Metrics
E-commerce businesses need product performance metrics to make smart inventory decisions and keep customers happy. These measurements show which products make money and which ones need improvement.
Best-selling items
Top-performing products can only be identified by looking at multiple data points at once. Smart retailers look beyond basic unit sales to think about revenue contribution and profit margins. Data analytics helps them understand their customers' priorities and make better decisions about product selection and pricing.
Note that profitable products do well because they either solve a problem, serve a passion, or make life easier for customers. Many businesses think their best sellers are just the ones that sell the most units.
A better, all-encompassing approach looks at:
- Product margins and overall profitability
- Customer feedback and satisfaction rates
- Seasonal performance patterns
- Market trends
Many stores judge their top products only by how many units they sell. This approach falls short when it comes to long-term growth and profits. When combined with inventory optimization and retail KPIs, businesses can figure out which products deserve the best placement and marketing attention.
Product return rates
Return rates tell you a lot about how well products perform and how satisfied customers are. E-commerce return rates average between 20-30%, which is by a lot higher than physical stores at 8.89%.
The industry data shows some interesting differences in return rates:
- Clothing and apparel tops the list at 26%
- Bags and accessories come in at 19%
- Shoes sit at 18% returns
Return patterns help spot issues throughout the customer's buying experience. The costs add up fast - handling and restocking a $50 return can cost about 59% of the selling price. For every $1 billion in sales, retailers lose around $165 million to merchandise returns.
Most returns happen for three main reasons:
- Product defects
- Customer dissatisfaction
- Shipping errors
Return rate analysis by product category helps businesses make smart decisions about inventory and product offerings. Studies show that retailers who track return rates can spot patterns and fix problems. To name just one example, better product descriptions and detailed sizing charts help reduce clothing returns.
Smart retailers use return data to improve their products and customer experience. Looking at return patterns helps them fine-tune their product lineup, adjust promotions, and improve sales strategies. Customer feedback from returns also gives valuable information to make products better.
Setting Up Your Tracking System
A resilient tracking system is the foundation of successful e-commerce analytics. We started by picking the right tools and created a well-laid-out measurement plan to track key ecommerce metrics.
Choose your analytics tools
The right analytics tools should match your business needs and data analysis requirements. Google Analytics stands out with approximately 38 million websites using it. Its extensive features and integration options make it so popular.
Your tool selection depends on several factors:
- Business size and complexity
- Data analysis requirements
- Integration needs with existing systems
- Budget considerations
Analytics platforms come with different capabilities. Hotjar serves over 1 million websites in 180+ countries and provides heatmaps and session recordings. Shopify Analytics helps 4.5 million stores with built-in tracking. WooCommerce Analytics supports more than 7 million WordPress websites.
The best analytics tool is one that your team uses regularly. Look for tools that give you both quantitative data like traffic numbers and sales totals, along with qualitative data from customer feedback.
Create a measurement plan
A measurement plan turns business objectives into measurable metrics and gives your team a framework for analytics setup. This document becomes your team's single source of truth.
Your measurement plan needs these key components:
- Define Business Objectives: Start with your top-line business goals.
- Establish Key Performance Indicators: List specific KPIs that line up with each objective.
- Consider Segmentation Requirements: Split performance targets by:
- Mobile and desktop users
- Geographic regions
- Product categories
- Implementation Planning: Find tracking gaps and build a detailed strategy. Tag management solutions like Google Tag Manager help make future changes easier.
The plan should show how business objectives translate into measurable performance metrics. This approach helps you make evidence-based decisions.
Regular upkeep ensures long-term success. Your technical needs, business goals, and the digital world will change. Review and adjust reports periodically to keep them accurate and relevant.
A well-laid-out measurement plan helps filter data noise from different platforms. Automated dashboards with important metrics let businesses monitor performance and make smart decisions about their ecommerce tracking.
Taking Action on Metric Insights
Raw data alone can't help businesses grow. We turned key ecommerce metrics into practical strategies that boost expansion and improvement.
Identify growth opportunities
Looking at collected data helps businesses understand market dynamics beyond their decision-makers' viewpoints. Companies that use data to make business decisions become more agile and spot new opportunities for success.
Looking at multiple data sources at once helps identify growth opportunities.
Companies that analyze customer behavior and purchasing patterns can spot trends that show:
- Product pricing optimization points
- Customer segment opportunities
- Marketing channel effectiveness
- Operational efficiency improvements
- Customer experience enhancement areas
Research shows that companies keeping close track of their ecommerce performance metrics are 60% more likely to outperform their competitors. Their advantage comes from knowing how to spot and act on patterns in their data sets.
Companies that learn the nuances of e-commerce metrics gain a strategic advantage. To cite an instance, analyzing bounce rates, average order value, and customer acquisition costs reveals important details about customers' buying experiences.
Make data-driven decisions
Data-driven decision-making focuses on collecting and using quality data to guide strategic business choices. The successful implementation needs a well-laid-out approach to turn insights into action.
Companies can improve their decision-making through business intelligence (BI) software, which offers several advantages:
- Real-time KPI monitoring
- Trend and pattern identification
- Automated report generation
- Enhanced team collaboration
Quality and accurate data form the foundation of effective data-driven decisions. So, businesses must gather representative and reliable data while thinking about all variables to avoid bias.
Studies show that companies focusing on data-driven strategies see revenue growth between 6% to 12%. On top of that, these companies deliver better customer experiences and show greater business agility.
Companies should focus on these aspects while making data-driven decisions:
- Clear objectives that line up with company goals
- Measuring factors that affect outcomes
- Analyzing relevant data sets for patterns
- Getting practical insights from findings
This approach ended up improving operational efficiency naturally - teams that analyze concrete facts avoid decisions that could harm the business.
Better customer experience comes from this approach too. By analyzing data from reviews, customer complaints, and surveys, businesses learn what helps and hurts their customer experience and retention. One retailer found through data analysis that their customers rarely bought shoes priced above $100, which led to strategic pricing changes.
Companies should take these steps to get the most from data-driven decisions:
- Monitor key performance indicators in real-time
- Generate automated reports for stakeholders
- Boost collaboration through shared insights
- Use predictive modeling for forecasting
Research shows 65% of B2B businesses will make data-driven decisions by 2026. Companies using data-driven strategies have seen five to eight times more ROI than those who don't.
Complete analytics tools make this process more effective. These solutions help measure marketing campaign success, improve decision-making, gain omnichannel traction, and guide comprehensive marketing efforts.
Conclusion
Tracking the right e-commerce metrics creates a clear picture of your online store's health and growth potential. Each metric - from simple sales figures to complex customer behavior patterns - serves as a vital piece of the puzzle that helps understand your business performance.
Companies that actively track these metrics experience 6-12% higher revenue growth and make better strategic decisions. These numbers represent actual opportunities to improve and grow your e-commerce business.
Metrics like cart abandonment rates, customer lifetime value, and acquisition costs reveal exactly where your store needs attention. You should start small and focus on a few key metrics that arrange with your current business goals. Your tracking can expand to include more sophisticated measurements as you become comfortable with data analysis.
The success in e-commerce depends on making informed decisions based on reliable data. These metrics reveal your customers' needs, priorities, and behaviors. They are not just numbers. You can use them wisely to build a stronger, more customer-focused online store.
FAQs
Q1. What are the most crucial metrics for e-commerce success? The most important metrics for e-commerce success include conversion rate, customer lifetime value, average order value, cart abandonment rate, and customer acquisition cost. These metrics provide insights into sales performance, customer behavior, and overall business health.
Q2. How can I improve my e-commerce conversion rate? To improve your e-commerce conversion rate, focus on optimizing your website's user experience, offering clear product descriptions, providing multiple payment options, and implementing a streamlined checkout process. Additionally, consider using targeted marketing strategies and personalized recommendations to encourage purchases.
Q3. What's the significance of customer lifetime value in e-commerce? Customer lifetime value (CLV) is crucial as it helps you understand the long-term value of each customer. By focusing on increasing CLV, you can make informed decisions about customer acquisition costs, retention strategies, and overall business growth. It also helps in identifying and nurturing your most valuable customers.
Q4. How can I reduce shopping cart abandonment in my online store? To reduce shopping cart abandonment, ensure transparency in pricing and shipping costs early in the shopping process, offer guest checkout options, provide multiple payment methods, and maintain a secure website. Additionally, consider implementing cart recovery emails and offering limited-time discounts to encourage completion of purchases.
Q5. What role does data-driven decision-making play in e-commerce growth? Data-driven decision-making is essential for e-commerce growth as it allows businesses to identify trends, optimize operations, and enhance customer experiences. By analyzing metrics and acting on insights, companies can make informed choices about product offerings, marketing strategies, and customer service improvements, leading to increased revenue and customer satisfaction.

Using BI Tools to Predict E-commerce Trends in 2025 | Diffshop
Global retail e-commerce sales will exceed $8 trillion by 2027. This milestone makes accurate prediction of e-commerce trends 2025 vital for business success. Most businesses - about 92% - now use generative AI to improve their e-commerce operations.
The e-commerce industry continues to evolve rapidly. Companies need data-driven decision making to stay competitive. Business Intelligence (BI) tools help analyze customer behavior and predict market changes. These tools also let companies spot emerging trends in ecommerce before their competitors.
In this piece, you'll discover how BI tools work to track and predict e-commerce patterns. You'll learn to pick the right data points and set up your first BI project. The knowledge will help you turn raw data into applicable information for your online stores.
Why You Need BI for E-commerce
Business Intelligence tools have become everything in online stores. Organizations that use BI tools reduce data preparation time by 40%, which results in faster decision cycles and improved output.
Keep up with trends
BI tools give an explanation of competitor activities, pricing strategies, and market positioning in real time. Companies learn about market gaps and growth opportunities by analyzing sales performance data. This analysis helps businesses adapt to market changes and maintain their edge over competitors.
Three ways BI gives you competitive advantage:
- Direct access to market trends and customer behavior patterns
- Early detection of new opportunities
- Up-to-the-minute tracking of competitor strategies
Make better decisions
Data reveals that 80% of companies using BI reported better operational efficiency. BI systems unite information from sales, marketing, finance, and operations into a single view. This united data helps managers identify patterns and make informed decisions quickly.
BI tools help businesses segment customers based on demographics, purchasing behavior, and priorities. This segmentation creates individual-specific experiences and targeted marketing campaigns.
Save time and money
BI software gives employees accurate report templates that cut down time spent on data preparation. It also helps staff members spend less time searching for information and more time analyzing it by bringing data sources together.
The financial benefits go beyond saving time. BI identifies inefficiencies in inventory management, supply chain, and pricing strategies. Businesses can detect underperforming products, optimize stock levels, and lower excess inventory costs.
BI tools automate manual tasks like data analysis and its coverage. This automation frees up resources for strategic initiatives and reduces administrative costs. Up-to-the-minute monitoring considers seasonal highs and lows, which helps businesses optimize pricing and marketing strategies.
Companies can track supplier performance, lead times, and delivery schedules through BI implementation to spot supply chain bottlenecks. This visibility helps businesses streamline operations and eliminate unnecessary expenses.
Pick the Right Data Points
Accurate e-commerce trend prediction relies on choosing the right data points. Let's look at three important categories of data that matter most.
Customer data
Customer information extends well beyond simple demographics. Businesses track purchase history, browsing patterns, and interaction metrics. This data helps predict future buying behavior and spot emerging e-commerce trends 2025.
The most valuable customer metrics include:
- Repeat purchase rates
- Customer lifetime value
- Net Promoter Score (NPS)
- Customer segmentation data
- Behavioral patterns
Businesses create targeted marketing campaigns by analyzing customer segments based on demographics, buying behavior, and priorities. This segmentation helps them spot new market opportunities and predict changing consumer priorities.
Sales data
Sales data shows how products perform and markets evolve. Companies study transaction histories to predict future sales outcomes and understand market needs.
Power BI and similar tools track sales changes in different regions, products, and time periods. This analysis reveals seasonal trends and helps optimize inventory levels. Companies can then adjust their stock based on expected demand patterns.
The analysis of sales data focuses on total revenue, product category performance, and transaction frequency. These numbers show which products might become popular in the coming months.
Website analytics
Website analytics measure visitor interactions with online stores. Key metrics include page views per session, bounce rates, and conversion pathways. This data shows where customers might face difficulties during their shopping experience.
Essential website metrics track:
- Direct traffic sources
- Search engine referrals
- Keywords driving traffic
- Page engagement rates
- Mobile vs desktop usage
Google Analytics and Adobe Analytics give detailed explanations about user interactions. These tools help predict which website features and products will become popular in upcoming seasons.
The analysis of website data helps companies understand how customers find products, what content interests them, and where they might leave during their shopping experience. This information shapes future e-commerce strategies and helps predict upcoming trends in online shopping behavior.
Set Up Your First BI Project
BI projects need good planning and strategic thinking. A well-laid-out approach helps predict e-commerce trends 2025 with better accuracy.
Define goals
Clear objectives form the backbone of any BI project. Business goals should be arranged with specific insights to achieve those goals. A detailed roadmap with timelines, milestones, and resource allocation builds a solid foundation.
Project success depends on understanding what users want. This includes both functional needs (what the BI application should do) and non-functional requirements (technical capabilities). We focused on:
- Data quality metrics
- Report usage tracking
- User adoption rates
- Performance indicators
Choose tools
The right BI tool selection needs assessment of multiple factors. Power BI stands out for its AI capabilities and machine learning integration. Tableau makes data available to everyone, whatever their technical expertise.
Tool choice affects productivity through optimized processes and workflows. Integration capabilities with existing platforms and scalability matter for future growth. The right tool should connect naturally with cloud platforms and traditional databases.
Cost-effectiveness is a vital part of tool selection. Premium features offer advanced capabilities, but many affordable options provide strong functionality. You should assess both immediate needs and long-term sustainability before making the final choice.
Train your team
Training leads to success in BI implementation. Detailed training helps employees understand data analysis tools and techniques. This knowledge leads to faster, more accurate decisions.
Building a data-driven culture needs ongoing support. Teams benefit from various learning resources, including text and video tutorials. Regular meetings with stakeholders help assess progress and tackle challenges quickly.
Teams working across functions prove vital during implementation. Working closely with department heads helps identify specific BI needs for different business functions. Mentoring programs keep valuable knowledge within the organization.
Data literacy training should cover simple concepts of data analysis and visualization tools. This foundation helps team members interpret data and get useful insights. All the same, note that business intelligence implementation is an ongoing experience, not a one-time event.
Analyze Market Patterns
E-commerce data reveals hidden market opportunities through pattern analysis. Companies that study customer behavior and product trends will have an edge in predicting e-commerce trends 2025.
Customer segments
RFM (Recency, Frequency, Monetary) analysis forms the foundation of smart segmentation. This method groups customers by their purchase history and how much they spend. Companies can spot valuable customer groups and predict what they might buy next.
Key metrics for customer segmentation include:
- Purchase frequency and value
- Brand loyalty indicators
- Channel priorities
- Response to promotions
- Lifestyle and interests
Companies that group customers with similar traits see better marketing ROI. These groups help predict which products will appeal to specific customers.
Product categories
Different sectors show varying rates of e-commerce adoption. Electronics and clothing dominate online sales and contribute substantially to the estimated $871 billion in online retail sales.
Food and drink categories show the highest growth potential, with a projected 30% increase through 2024. This growth comes from changing consumer priorities and better delivery systems.
Category management needs constant monitoring of:
- Sales performance across regions
- Seasonal fluctuations
- Cross-category relationships
- Price sensitivity levels
Product category analysis helps companies spot emerging trends and adjust their inventory levels.
Geographic trends
Business intelligence combined with geographic data creates competitive advantages. This approach helps companies:
- Spot regional market opportunities
- Predict changes in consumer priorities
- Adapt commercial strategies
- Optimize supply chains
Location-based analysis shows unique buying patterns in different regions. Through geographic analysis, companies can:
- Line up sales boundaries with market potential
- Improve territory visualization
- Sharpen regional sales strategies
- Calculate supply chain resilience
Maps and spatial analysis reveal inequities in real estate and site selection. This information helps companies make smart decisions about expansion and market entry strategies.
Geographic business intelligence tools give quick access to digital maps with multiple information layers. These tools predict areas with high success probability and help optimize operations based on regional differences.
Geographic and business intelligence together create powerful insights to predict e-commerce trends 2025. This combination helps companies understand not just what customers buy, but where and why they make their purchases.
Find Hidden Opportunities
Business Intelligence helps companies find profitable opportunities through advanced data analysis. Companies that use BI for cross-selling see a 25-95% increase in profits when they boost customer retention by just 5%.
Cross-selling potential
Smart data analysis shows the perfect timing for product recommendations. Amazon's "Frequently Bought Together" feature generates 35% of its revenue through cross-selling.
BI tools examine purchase patterns and identify complementary products. Existing customers have a 60-70% buying probability, while new prospects only show 5-20%. This knowledge helps businesses create targeted bundles that increase average order value.
Key benefits of BI-powered cross-selling:
- Identifies product relationships and buying patterns
- Predicts customer's future purchase priorities
- Spots seasonal buying trends
- Creates effective product bundles
- Measures promotion performance
Predictive models suggest products based on customer's purchase history and browsing behavior. BI systems track the best moments to present cross-sell offers, which results in higher conversion rates.
New market segments
BI tools find untapped customer groups through detailed segmentation. Machine learning algorithms analyze customer behavior patterns beyond simple demographics to identify promising new segments.
Geographic intelligence works with behavioral data to find regional opportunities. This method combines location-based trends with customer priorities, showing which products excel in specific regions.
Customer lifetime value calculations determine segment targeting priorities. Businesses can allocate resources to segments with the highest potential and predict which ones will propel development in e-commerce trends 2025.
Predictive analytics improves segment discovery by:
- Analyzing customer purchase patterns
- Identifying seasonal priorities
- Spotting regional variations
- Tracking segment-specific responses to promotions
Data mining techniques reveal hidden connections between products and customer groups. Businesses can adapt their offerings to match emerging consumer needs, which results in targeted marketing campaigns and higher conversion rates.
BI systems automate personalized recommendations delivery through channels of all types. This automation helps businesses scale their targeting efforts while they retain control over relevance for each segment.
Predict Future Trends
AI-powered predictive analytics helps e-commerce businesses spot future trends with remarkable precision. According to Gartner, 80% of customer service organizations will use AI by 2025.
Use AI models
AI algorithms analyze huge datasets to predict customer behavior and market changes. These models get into historical sales data, customer interactions, and market trends to generate accurate forecasts.
AI-powered analytics delivers these capabilities:
- Reduce supply chain errors by 30-50%
- Predict product demand through past data analysis
- Forecast stock availability for upcoming seasons
- Identify emerging customer priorities
AI models help businesses adapt quickly to market changes. They spot subtle correlations human analysts might miss. This guides more precise inventory management and boosts customer satisfaction.
Test scenarios
Scenario planning prepares businesses for different possible futures in e-commerce. Only 9% of companies feel confident about knowing how to forecast demand. This gap shows why better testing methods matter.
Several scenario testing approaches work well. Qualitative forecasting suits new products or global expansion best. Quantitative forecasting relies on statistical analysis and historical data.
Companies use both methods in hybrid forecasting. This approach combines hard data with expert insights and using a product research tool. The process looks at various factors:
- Customer behavior patterns
- Market trend changes
- Competitor actions
- Technology changes
- Regulatory updates
Update forecasts
Accurate forecasts need regular updates. Companies can adjust strategies based on live data. This creates a dynamic system that adapts to market changes quickly.
Social media analysis makes data forecasting more precise. Companies update their forecasts in hours instead of weeks. Quick updates help businesses respond faster to changing customer priorities.
AI and machine learning continue to improve forecast accuracy. These tools analyze multiple data sources:
- Historical sales figures
- Market trends
- Social media patterns
- Weather data
- Government regulations
Propensity-based predictions look at individual opportunities, while run rate models analyze total sales volumes in business segments. 86% of businesses using predictive analytics report beneficial results.
AI integration with business intelligence creates powerful predictive capabilities. Natural language processing and image recognition boost prediction accuracy by identifying trends and priorities. This detailed approach helps businesses make smart decisions about resource allocation and sales operations.
Turn Data Into Action
Raw data can't drive business growth by itself. The real difference between gathering information and getting results lies in turning insights into practical steps.
Create action plans
Success starts with clear objectives in action plans. Your data action plans should match specific business goals, such as boosting sales or improving customer retention.
A well-laid-out action plan has:
- Defined initiatives with measurable outcomes
- Resource allocation guidelines
- Performance tracking metrics
- Implementation roadmap
- Team responsibilities
Power BI and similar tools help track progress through customizable dashboards. These dashboards show real-time KPIs that let teams quickly adjust their strategies. The main focus remains on turning data insights into activities that generate revenue.
Business intelligence software lets companies analyze customer behavior patterns. Teams can create targeted marketing campaigns and optimize product offerings once they spot trends. Action plans must stay flexible and evidence-based, whether you're dealing with inventory management or customer service.
Set timelines
Project timelines shape the success of e-commerce initiatives. Many businesses don't deal very well with timeline estimation because market conditions keep changing. Setting realistic deadlines helps teams manage resources better.
Power BI reporting sends automated alerts for key metrics. Teams can respond quickly to maintain project momentum when certain thresholds get crossed. These alerts help prevent implementation delays.
Timeline planning looks at several factors:
- Data collection and analysis periods
- Team training requirements
- System integration timeframes
- Testing and optimization phases
- Review and adjustment cycles
Businesses should review metrics and KPIs regularly. This practice helps spot areas that need improvement and adapt tactics based on how customer behavior changes. Companies can update their strategies using real-time insights instead of outdated assumptions.
Custom BI tools give unique advantages for timeline management. These solutions track sales performance, customer behavior, and product trends in ways that fit specific business processes. Centralizing data leads to faster decision-making through more efficient analysis.
Power BI's visualization capabilities turn complex data into clear action items. Teams can create and share reports easily, which encourages collaboration across departments. This approach helps keep different business units working on e-commerce trends 2025 in sync.
Advanced BI tools use predictive analytics to forecast when projects will finish. These systems help businesses spot potential delays and adjust resources by analyzing historical data. Machine learning capabilities make these predictions more accurate.
Regular meetings with stakeholders help teams review progress and tackle challenges quickly. Businesses can keep moving toward their e-commerce goals while staying responsive to market changes through consistent monitoring and adjustment.
Avoid Common Mistakes
The success of predicting e-commerce trends in 2025 largely depends on avoiding common data and implementation mistakes. Recent studies show that poor data quality costs organizations an average of USD 15.00 million per year.
Data quality issues
Data quality problems affect every aspect of business intelligence. Note that 30% of online shoppers abandon their carts due to incorrect product data. Businesses face three most important data quality challenges:
- Inaccurate product details and pricing
- Missing or incomplete information
- Delayed up-to-the-minute updates
Bad data quality creates ripple effects throughout operations. 58% of organizations blame staff data entries for bad quality data. Businesses must implement strict data cleansing processes along with automation tools.
Data quality management needs a systematic approach. Only 3% of businesses' data meets simple quality standards. Data governance policies are vital to maintain data integrity through:
- Regular audits
- Clear roles and responsibilities
- Standardized data entry procedures
Wrong metrics
Wrong metrics guide businesses toward misguided decisions. 57% of business owners prioritize improving data quality. This focus comes from understanding that incorrect metrics hide real performance issues.
Key performance indicators need careful selection. Businesses often track vanity metrics instead of practical data points. To name just one example, see how monitoring total page views without analyzing conversion rates provides incomplete insights.
Common metric selection mistakes include:
- Tracking too many metrics simultaneously
- Ignoring customer lifetime value
- Focusing solely on short-term gains
Poor implementation
Bad BI implementations often result from inadequate planning. 80% of all data projects fail despite having excellent technical prerequisites. This failure rate shows why proper implementation strategies matter.
Team expertise plays a vital role in success. Business analysts, data architects, and engineers are the most sought-after resources. Organizations should balance internal capabilities with external support to get optimal results.
Implementation success needs:
- Clear project goals and timelines
- Detailed team training
- Regular progress evaluation
Data integration creates significant challenges. Up-to-the-minute updates for inventory, pricing, and order statuses need careful system coordination. Technical glitches or network delays can disrupt data synchronization and lead to customer dissatisfaction.
Security concerns deserve priority attention. E-commerce platforms handle sensitive customer and payment information. Strong security measures protect against data breaches that could damage brand reputation and customer trust.
Companies should avoid rushing into BI implementation without proper planning. Common mistakes include:
- Having vague goals
- Missing detailed implementation plans
- Assigning projects to inexperienced team members
Data quality tools help solve common implementation problems. These tools:
- Identify and fix data anomalies
- Maintain consistent data formats
- Enable clear reporting structures
Cloud-based solutions bring unique challenges. Organizations should think about:
- Data migration strategies
- Employee access controls
- Compliance requirements
- Security protocols
BI implementation's success depends on building proper foundations. Recent research shows that businesses using data effectively see increased revenue, reduced costs, and improved customer satisfaction. These results need careful attention to data quality, metric selection, and implementation processes.
Conclusion
Business Intelligence tools are essential for predicting e-commerce trends 2025 and trending products for dropshipping. Data analysis and AI capabilities give businesses a major edge in the fast-growing digital world.
The recipe for success has three ingredients. Businesses need to pick the right data points from customer behavior, sales patterns, and website analytics. They should implement BI tools with clear goals and well-trained teams. These insights must turn into practical strategies that show measurable results.
Power BI and other platforms help companies discover new opportunities ahead of their competitors. The tools analyze customer segments and predict buying patterns that reveal cross-selling possibilities. AI-powered forecasting cuts supply chain errors by 30-50% and makes inventory management better.
Data quality is crucial. Companies should focus on collecting accurate information, select the right metrics, and follow a structured approach to implementation. Teams need regular updates and monitoring to keep their predictions and strategy execution precise.
Smart companies that adopt BI tools now will be ready for tomorrow's e-commerce world. Market leaders will emerge from those who become skilled at analytical decision-making, as global retail e-commerce sales grow beyond $8 trillion by 2027.

How Diffshop Helps You Find Trending Products Faster Than Ever
In the fast-paced world of e-commerce, staying ahead of trends can mean the difference between a thriving business and a stagnant one. For dropshippers, Amazon sellers, and DTC brands, identifying winning products before competitors do is critical. Yet, sifting through endless data across platforms like Amazon, Shopify, TikTok, or Facebook can feel overwhelming. Enter Diffshop—a game-changing product research tool designed to simplify trend discovery, competitor analysis, and data-driven decision-making.
In this article, we’ll explore how Diffshop empowers sellers to uncover trending products faster than ever, streamline their workflows, and build profitable e-commerce businesses. Whether you’re learning how to find trending products or mastering how to find trending products to dropship, Diffshop is your ultimate ally.
Why Product Research Matters in E-Commerce
The e-commerce landscape is crowded, and consumer preferences shift rapidly. What’s viral today might fade tomorrow. Successful sellers don’t rely on guesswork—they leverage real-time data to:
- Identify high-demand products.
- Analyze competitor strategies.
- Optimize ads and listings for maximum visibility.
- Capitalize on emerging niches.
Traditional research methods, like manual platform scraping or relying on limited analytics tools, are time-consuming and often outdated. Diffshop solves this by aggregating billions of data points across Amazon, Shopify, Shein, Temu, Facebook, Instagram, and TikTok, delivering actionable insights in seconds.
What Makes Diffshop Unique?
Diffshop stands out as the most comprehensive product research tool on the market. Here’s why:
- Multi-Platform Coverage:
- While competitors focus on a single platform (e.g., Shopify or Amazon), Diffshop monitors 1 billion+ products across Amazon, Shopify, Shein, Temu, Facebook, Instagram, and TikTok. This cross-platform visibility ensures you never miss a trend, no matter where it emerges.
- Four Pillars of Insight:
- Diffshop consolidates data into four intuitive sections:
- Product Research
- Ad Research
- Store Research
- Keyword Research
- Each section offers granular filters to refine results, from sales metrics to engagement rates.
- Real-Time Data:
- Diffshop’s live monitoring tracks SKUs, ads, keywords, and store performance as they update—ensuring you act on the freshest insights.
- User-Friendly Interface:
- No technical expertise required. With a few clicks, sellers of all experience levels can uncover winning products or ads.
How Diffshop Works: A Deep Dive into Its Features
1. Product Research: Discover Bestsellers and Hidden Gems
Diffshop’s Product Research tool scans 1 billion+ products on Amazon, Shopify, Shein, and Temu. Key filters include:
- Units sold
- Sales revenue
- Month-over-month growth rate
- Launch date
- Customer ratings
Use Cases:
- Find trending products (e.g., a viral skincare tool on TikTok).
- Identify niche markets with high growth potential.
- Track new arrivals to capitalize on early demand.
For a step-by-step guide on how to find trending products to dropship, explore Diffshop’s Product Research module.
2. Ad Research: Decode Viral Campaigns
Monitor 10 million+ ads on Facebook, Instagram, and TikTok. Filter by:
- Engagement metrics (likes, shares, comments)
- Impressions and ad spend
- Landing page performance
- Keywords in captions
Use Cases:
- Reverse-engineer high-performing ads for inspiration.
- Analyze competitors’ ad strategies and creatives.
- Estimate ad costs to budget effectively.
Discover how to find trending products with ad performance data using Diffshop’s Adspy tool.
3. Store Research: Spy on Top Competitors
Gain insights into 1 million+ Shopify stores, including:
- Traffic sources and growth rates
- Top-selling products
- SEO strategies (keywords, backlinks)
- Social media integration
Use Cases:
- Benchmark your store against industry leaders.
- Uncover competitors’ traffic sources (e.g., organic vs. paid).
- Identify partnership opportunities with complementary brands.
4. Keyword Research: Optimize for Search Engines
Analyze 200 million+ e-commerce keywords on Google. Track:
- Search volume and CPC
- SEO difficulty
- Keyword-driven traffic to Shopify stores
Use Cases:
- Optimize product listings for SEO.
- Discover untapped customer search intent.
- Refine PPC campaigns with high-converting keywords.
The Diffshop Advantage: Data-Driven Decisions Made Simple
A. Stay Ahead of Trends
Diffshop’s cross-platform monitoring ensures you spot trends early. For example, if a product gains traction on TikTok ads, you’ll see its sales spike on Amazon or Shopify stores in real time.
B. Competitor Analysis at Your Fingertips
Why reinvent the wheel? Study top-performing stores and ads to replicate success while avoiding costly mistakes.
C. Streamline Product Launches
Validate ideas before investing in inventory. Use keyword and sales data to gauge demand and forecast profitability.
D. Boost Ad ROI
Create high-converting ads by analyzing what’s already working. Tested creatives and captions reduce trial-and-error spending.
Who Should Use Diffshop?
- Dropshippers: Find trending products to dropship faster with cross-platform insights.
- Amazon Sellers: Diversify by identifying trends on social media and Shopify.
- DTC Brands: Optimize listings, ads, and SEO to stand out in crowded markets.
- Agencies: Deliver data-backed strategies to clients.
Diffshop vs. Competitors
Conclusion: Future-Proof Your E-Commerce Business
In a world where trends come and go in a blink, Diffshop equips you with the tools to not just keep up—but lead. By merging multi-platform data, user-friendly design, and actionable insights, it eliminates the guesswork from product research.
Whether you’re launching a new store, optimizing ads, or exploring niches, Diffshop ensures you make decisions backed by 1 billion+ data points. Don’t chase trends—predict them.
Ready to transform your e-commerce strategy?

How to Sell on Shein: The Ultimate Guide for Becoming a Third Party Seller on Shein in 2024
Selling on Shein offers a lucrative opportunity for fashion entrepreneurs and designers. This guide will walk you through the steps to start selling on Shein and make the most of this popular marketplace.
Why Sell on Shein?
Shein is a global fast-fashion retailer known for its trendy and affordable clothing. By joining the Shein marketplace, you gain access to a vast audience of fashion-conscious buyers, streamlined logistics, and marketing support.
Getting Started on Shein
- Sign Up: Create an account on the Shein marketplace. Visit Shein Seller Central to begin the registration process.
- Submit Your Application: Provide necessary business information, including your brand story, product range, and manufacturing capabilities. Shein's team will review your application and approve suitable brands.
- Set Up Your Store: Once approved, you can set up your store by adding product listings. Ensure that your product images are high-quality and descriptions are detailed to attract buyers.
Shein Marketplace Seller Requirements
- Minimum $2 million annual revenue
- Domestic US-based operations
- Ship directly to customers from the US
- Professional sellers
Steps to Start Selling on Shein
- Apply to Become a Seller
- Fill out the quick seller application and the Shein team will reach out within one business day.
- Required documents: Certificate of Incorporation, most recent W-9/W-8BEN-E form, Trademark Registration Certificate, store logo, ID/Driver's License/Passport of the company representative.
- List Your Products
- Upload products via API connection, solution providers, or Shein Seller Hub.
- Manage inventory, sales orders, customer insights, and product performance through the Seller Hub.
- Ship Your Orders
- Use your preferred fulfillment method, ensuring adherence to Shein’s shipping requirements.
- Options include in-house US warehouse, 3rd party warehouse, and multi-channel fulfillment.
- Get Paid
- Payments are authorized every Monday, with a one-week payment cycle.
- Receive payments in 1-3 business days after Shein confirms the order and applies for settlement.
Key Features of Selling on Shein
- Product Listing: Use the platform's tools to create and manage product listings. Include detailed descriptions, high-quality images, and accurate sizing information.
- Order Management: Shein provides an order management system to track and fulfill orders efficiently. Keep an eye on your inventory and restock popular items promptly.
- Marketing Support: Take advantage of Shein's marketing tools to promote your products. Participate in sales events, use sponsored ads, and engage with Shein's large customer base through social media.
- Analytics: Utilize the analytics dashboard to monitor your sales performance, customer behavior, and market trends. This data can help you make informed decisions to optimize your store's performance.
Tips for Success on Shein
- Stay Trendy: Keep up with the latest fashion trends and update your inventory regularly to meet customer demands.
- Quality Control: Maintain high-quality standards for your products to ensure customer satisfaction and reduce returns.
- Competitive Pricing: Research your competitors and price your products competitively. Offering discounts and promotions can also attract more buyers.
- Customer Engagement: Engage with your customers through reviews and feedback. Providing excellent customer service can build loyalty and encourage repeat purchases.
Conclusion
Selling on Shein offers a great opportunity to reach a wide audience and grow your fashion brand. By following the steps outlined in this guide and utilizing the platform's features, you can build a successful online store on Shein. Start your journey today by visiting Shein Seller Central.
All Articles
Category

Top TikTok ads of the week 2023-07-16
This is the Diffshop weekly selection of top TikTok ads!
We have created a snapshot for you! We make our picks based on engagement metrics, ad creatives and popularity index. Read the report below, learn ad ideas, get inspiration and improve your own TikTok Ad ROI!
With Diffshop, you can achieve a lot more! We help you to gain first hand insights into the e-commerce world, Imagine what you can achieve if you have the insights your competitors don't! Diffshop offers live monitoring of 9M+ stores, 1B+ products, 200M+ keywords and 60M+ ads, try our incredible features now: Shopify Store Research、Shein Product research、 Facebook Ad Research、Instagram Ad Research、TikTok Ad Research。
hellomolly
@amara looking like an absolute prom queen in our Dear Emilia Shimmer ... | prom dresses | TikTok
hismile
This was ONLY 30-seconds 😲 #productreview | HiSmile Review | TikTok
courtneysarracino
#nuunpartner muscle mommies stay hydrated @Nuun Hydration | courtneysarracino | TikTok
alexajaggs
my mom is so jealous of me rn #comedy #vlog #Gerd #acidreflux #tums #o... | gerd pillow | TikTok
dracoslides
Slides to buy instead of Yeezys slides ✅ @jeromenolabel #fyp #viral #... | draco slide | TikTok
allisonkuch
what’s next? my hair products? keep your hands off my @Sol de Janeiro ... | sol de janeiro | TikTok
ashleytsims
So excited @EVRY JEWELS 🫶🌞 #evryjewels #foryoupage #haul #collab | Evry Jewels | TikTok
truheight_vitamins
#fyp #foryoupage #foryou #truheight | truheight reviews | TikTok
madame.tartempion
I musch prefer a dewey, healthy glow with minimal products these days.... | french makeup look | TikTok

Top Facebook ads of the week 2023-07-16
This is the Diffshop weekly selection of top Facebook ads!
We have created a snapshot for you! We make our picks based on engagement metrics, ad creatives and popularity index. Read the report below, learn ad ideas, get inspiration and improve your own Facebook Ad ROI!
With Diffshop, you can achieve a lot more! We help you to gain first hand insights into the e-commerce world, Imagine what you can achieve if you have the insights your competitors don't! Diffshop offers live monitoring of 9M+ stores, 1B+ products, 200M+ keywords and 60M+ ads, try our incredible features now: Shopify Store Research、Shein Product research、 Facebook Ad Research、Instagram Ad Research、TikTok Ad Research。
Chef saadat
Tawa Kaleji aur thandi Coca-Cola? Count me in! Some memories stay with us forever, just like Ammi’s special Kaleji which she used to make every Bakra Eid. It was an Eid tradition for us and whether you’re a Kaleji fan or not, chakhna must tha. Aaj woh naheen hain, lekin un kay khanon ke zariye un kay haath ka zaiqa yaad rakhna is my #RecipeforMagic! What’s yours? @cocacolapk #cokeandmealspk #eid #eiuladha -#kaleji #chefsaadat
True Classic
👕 See why everyone is raving about these tees 👕
Shopify
Want to make more 💸 💸 💸? Start selling the hottest items with Shopify and launch your own business today.
TransferKingdom
- Full Color T-shirt ready in 15 Sec. ! - No weeding needed ! - No color minimum ! - Full color, Excellence Quality prints! - Easy to apply ! - Print lasts for at least 100 washes ! - Can be pressed on any kind of apparel ! Transfer Kingdom is here to support all your Transfer needs! With 5 years of DTF transfer experiance, We offer full support and exclusive quality prints. Say goodbye to the days of weeding vinyl or setting up screens for multi color jobs! With no color minimum and vibrant, radiant images, DTF printing is here to stay. (DTF) transfers are full-color heat applied transfers for light and dark garments. No weeding or masking is required and DTF transfers can be applied to cotton, cotton/poly blends, and even 100% polyester.
Sallie Mae
Hey first-gen students—make sure your voice is heard! Read about Estrella’scollege experience as a Latina overcoming anxiety: https://sallie.cc/FindingYourVoice
Safaricom PLC
📱🔥Open Day is back! Get ready for jaw-dropping discounts up to 30% off on selected phones and accessories. Don't miss out on these incredible offers by visiting any Safaricom shop, authorized dealer outlets, or www.masoko.com to grab yours today! #SafaricomOpenDay
L'Oréal Professionnel
Break the stressful cycle of HAIR THINNING: Serioxyl Advanced by L'Oreal Pro! Co-created by hairdressers and approved by dermas*, see denser hair in 6 weeks! It's a #NewStartAhead!
Neemans
Walking or Chilling, our Light Walkers takes care of both your needs most comfortably. Give it a try!
Glamorise
Comfort and Support In a Snap

Top TikTok ads of the week 2023-07-02
This is the Diffshop weekly selection of top TikTok ads!
We have created a snapshot for you! We make our picks based on engagement metrics, ad creatives and popularity index. Read the report below, learn ad ideas, get inspiration and improve your own TikTok Ad ROI!
With Diffshop, you can achieve a lot more! We help you to gain first hand insights into the e-commerce world, Imagine what you can achieve if you have the insights your competitors don't! Diffshop offers live monitoring of 9M+ stores, 1B+ products, 200M+ keywords and 60M+ ads, try our incredible features now: Shopify Store Research、Shein Product research、 Facebook Ad Research、Instagram Ad Research、TikTok Ad Research。
thebeachwaver
We are absolutely in love with these beachy waves on @jilissa 💕 So go... | beach waver review | 65.5M 次观看 | TikTok
abbieaporter
the best thrifted finds ever from @Go Thrift 🎀💕✨ #gothrift #y2k #y2... | go thrift | TikTok
arlizle
Hair days r the best days!!! @Demi DeLuna and @amika have been keepin... | amika | 14.3M 次观看 | TikTok
edwardzo
This IYKYK Asian skincare product is truly iconic for a reason @skii.u... | TikTok
bluewaterhome
Love is an understatement for this vacuum 🫶🏼🩵💜 #dysonUSA #dyson #d... | TikTok
theouai
Fine, medium or thick. We got you. | TikTok
hismile
The purple goo does WHAT?! 🫣#mindblown #viralvideo | Hismile Review | 18.6M 次观看 | TikTok
frankgreen_official
GET FLIPPING EXCITED 🥳 Our NEW Flip Straw Lids are here 🤩 Enjoy easy... | frank green flip straw | 1.4M 次观看 | TikTok
winston_da_ween
THE HEK IS A SMOOTHIE BOWL??? This was absolutely chaotic but deliciou... | TikTok

Top Facebook ads of the week 2023-07-02
This is the Diffshop weekly selection of top Facebook ads!
We have created a snapshot for you! We make our picks based on engagement metrics, ad creatives and popularity index. Read the report below, learn ad ideas, get inspiration and improve your own Facebook Ad ROI!
With Diffshop, you can achieve a lot more! We help you to gain first hand insights into the e-commerce world, Imagine what you can achieve if you have the insights your competitors don't! Diffshop offers live monitoring of 9M+ stores, 1B+ products, 200M+ keywords and 60M+ ads, try our incredible features now: Shopify Store Research、Shein Product research、 Facebook Ad Research、Instagram Ad Research、TikTok Ad Research。
Akshay Kumar
What’s his is mine and what’s mine is of course mine 😂 #ForceIX : Gender free clothing for all! Available on @myntra. @twinklerkhanna @forceixofficial #EngineeredWithEmotion
VitaClay Chef
#winter #tonic #oxtail or #shortribs #stew with #organic tomato sauce, #farmfresh tomatoes, #carrots potatoes #slowsimmered in #Vitaclay for 2-3 hours! Meat falling out of the bone... tender and juicy! #yuuuummmm #oxtail is rich in collagen from the cartilage that imparts a smooth richness to the stew. My TCM doctor cooks this for enhanced “chi” energy flow in winter, nourishing spine and strengthening bones... This Oxtail recipe is packed with minerals, collagen, glutamine, glycine and proline which are all necessary in healthy cell growth and functioning. It makes very nutritious healing soup or stew. It is an extremely simple dish to make! Check the recipe here-feel free to add more water to make it nourishing #soup too! Or with your favorite #spices #herbs https://vitaclaychef.com/blogs/recipes/flavorful-jamaican-beef-with-bone-in-stew-or-oxtails-in-clay
Rana Hamza Saif-RHS
I wanted to recreate the nostalgic memories of “Lamb Mandi” & “Al Baik” from my Hajj experience last year for my family who were doing Umrah with me this year. We visited two places to create our #RecipeForMagic: 1. Enjoying Al Baik’s mouthwatering chicken broast with an ice-cold Coca-Cola while sitting in Masjid-e-Nabvi. 2. Savoring the incredibly tender and juicy Lamb Mandi, where the magic truly happened when we ate it with our hands and took sips of chilled Coke. Share away your #RecipeForMagic and your nostalgic moments below! #cokeandmealspk #lamb #mandi #albaik #meatlover #saudiarabia #hajj #food #foodstagram #nostalgia
Unique Flags
South Carolina Flag! Get It Here ➡ https://shop.flagwix.com/mlaptlglriz Decorate home and garden with this eye-catching special flag!
EazyBrandz
Crispy Bacon That's Out of This World!
DevGange
⭐⭐⭐⭐⭐ (4.5 Star ratings from 6500+ Customers) Introducing the finest wooden replica of Ram Janmbhoomi Mandir Ayodhya - a true masterpiece that will add elegance and spirituality to your home decor. Handcrafted by skilled artisans using premium quality wood, this replica is perfect for worshipping and meditation, bringing peace and harmony to your space. And if you're looking for a unique gift that truly captures the essence of India's rich culture and heritage, look no further than our wooden replica. With its exceptional craftsmanship and attention to detail, it's the best in the market. Order now and own a piece of culture that will inspire generations to come. 🛕Handcrafted by skilled artisans using premium quality wood 🛕Captures every intricate detail of the magnificent temple 🛕Perfect for home decor, worshipping, and meditation 🛕Adds elegance and spirituality to your living space 🛕Makes a unique and thoughtful gift for any occasion 🛕Best in the market in terms of craftsmanship and attention to detail 🛕A timeless piece that celebrates India's rich cultural heritage Order now and elevate your home decor and spirituality with this exquisite wooden replica of Ram Janmbhoomi Mandir Ayodhya. https://devgange.in/products/wooden-shree-ram-janmabhoomi-temple-ayodhya
Lumens
An eco-warrior before it was cool, David Trubridge's commitment to improving the planet shows in his design aesthetic, production methods and approach to life. Read the interview here: http://more.lumens.com/KUjR50OXCbs
iHeartDogs.com
Grab your FREE yard flag while supplies last! Just cover a small S&H that also includes donation to feed shelter dogs! Available here 👉 https://iheartdogs.com/product/free-welcome-friends-paw-usa-garden-flag/?utm_source=FB-Ad_FreeWelcomeFriendsUSAIMG&utm_medium=link&utm_campaign=FB-Ad_FreeWelcomeFriendsUSAIMG
Men's Journal
See why #ArcticCool is changing the game! "Clothing we can wear out that will keep us comfortable but stylish as well. And when we tell you that Clothing From Arctic Cool is going to do that job and do it well, you should believe us." - Men's Journal
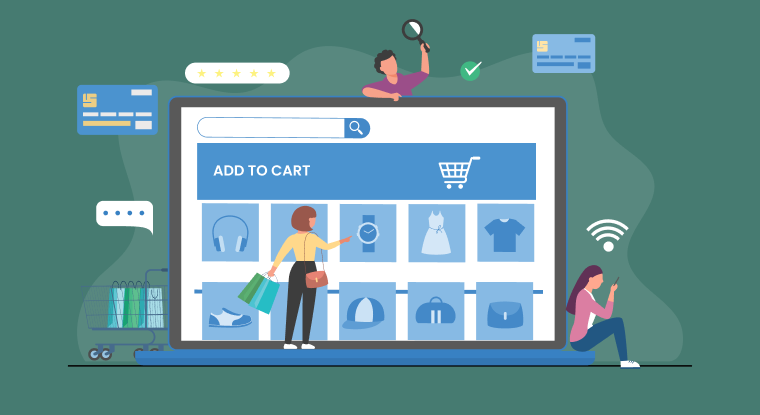
Maximize Your E-Commerce Success with Diffshop: The All-In-One Shopify Inspector Sellers
As an e-commerce seller, you know how important it is to stay ahead of the competition and maximize your sales with popular products. That's where Diffshop comes in.
Diffshop is an all-in-one data platform that offers live e-commerce data monitoring across three main traffic channels: Organic (Shopify, Magento...), Social (Facebook, Instagram, TikTok...), and Search (Google). With this comprehensive tool, you can conduct competitor analysis, find the right products to sell, optimize your SEO and listings, and research ad creatives and competitors.
One of the key features of Diffshop is store research, which allows you to monitor over 5,000,000 DTC stores (Shopify, Magento...) and find your closest competitors through lists, filters, or searches. This can give you valuable insights into what's working for other stores and help you make informed decisions about your own store.
In addition to store research, Diffshop also offers product research, with live monitoring of 600,000,000+ SKUs from 5,000,000+ DTC stores. This is the most comprehensive product research tool available, making it easy for you to find the right products to sell in your store.
Diffshop also has a keyword research feature, which offers live monitoring of 200,000,000+ keywords from search engines. With the world's first reverse search function, you can easily find the most suitable keywords for your marketing efforts and optimize your listings for better visibility.
Finally, Diffshop's ad research feature allows you to monitor over 100,000,000 ads posted by 5,000,000+ DTC stores across all social media channels. This can help you get ideas for your own ad campaigns and stay up to date with the latest trends in e-commerce advertising.
Besides the above functions, Diffshop also offers a range of resources and support to help you make the most of our platform. From tutorials and guides to a dedicated customer support team, we are here to help you every step of the way.
With so many features and benefits, it's no wonder that Diffshop is becoming the go-to tool for e-commerce sellers looking to take their stores to the next level. Sign up for Diffshop today and see the difference it can make for your business! Here is the free version waiting for you! Diffshop | E-Commerce Shopify DTC Store Spy Inspector | Product Research Tool
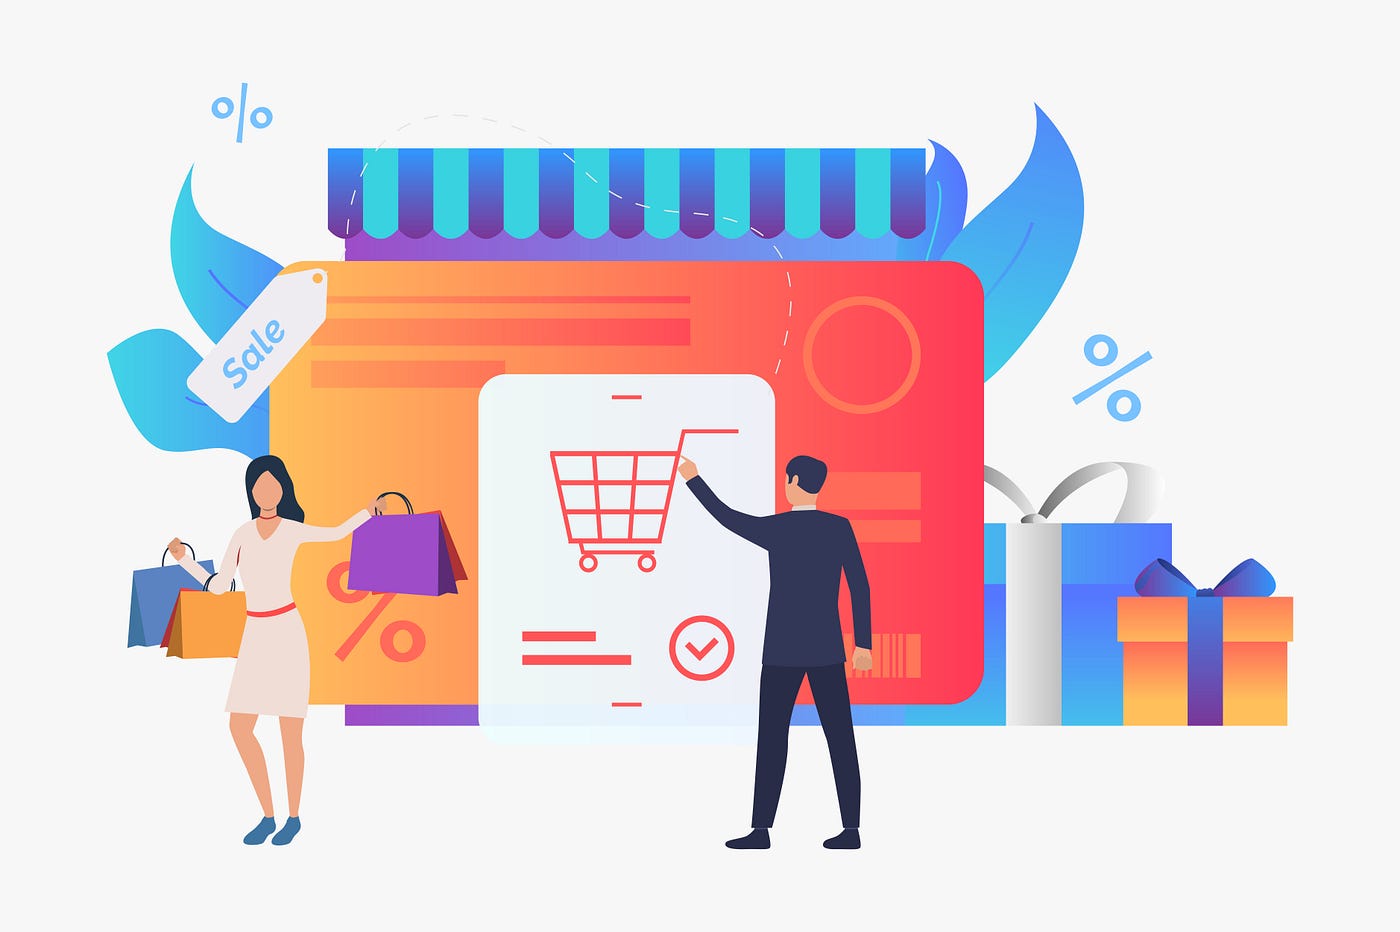
Want to Boost Your Shopify Sales? Try Diffshop, the Ultimate DTC Inspector and Shopify Spy
Are you a Shopify seller looking to increase your sales and stay ahead of the competition? Diffshop is the perfect tool for you! Diffshop is an all-in-one data platform that offers live e-commerce data monitoring across three main traffic channels: Organic (Shopify, Magento, Shein...), Social (Facebook, Instagram, TikTok...), and Search (Google). With this comprehensive tool, you can conduct competitor analysis, find the right products to sell, optimize your SEO and listings, and research ad creatives.
As a Shopify seller, it's important to constantly analyze and optimize your store to increase sales. With Diffshop, you can easily track the performance of other Shopify stores and see what strategies they are using to succeed. This can give you valuable insights and help you make informed decisions about your own store.
But how do you find products to sell on Shopify in the first place? It's simple: just follow these steps.
1. Identify your target market: Who do you want to sell to? What are their interests and needs?
2. Research trends and bestsellers: Look for popular and in-demand products. You can use tools like Product Research to identify trends and bestsellers. Also, Store Research can help you find popular stores with detailed insight. By the way, don’t forget the Ad Research tool, which can give you insights into what content is resonating with audiences and what product everyone likes and reposts the most on social media channels like Facebook, Instagram, and TikTok. Use these tools provided by Diffshop to help you succeed as an e-commerce seller.
3. Find suppliers: Once you have identified potential products, you will need to find suppliers who can provide those products at a competitive price. To find suppliers, you can use wholesale directories, supplier databases, and trade shows.
4. Evaluate the potential for each product: Consider the competition, the potential profit margin, and the demand for each product before deciding which ones to sell.
By following these steps, you can find the perfect products to sell on your Shopify store and increase your sales. So why wait? Sign up for Diffshop today, and take your Shopify store to the next level! Here is the free version waiting for you! Diffshop | E-Commerce Shopify DTC Store Spy Inspector | Product Research Tool